
The People

Cartographers.
Geographers.
Storytellers.

A specialized data visualization collective integrated within Woodwell Climate. By collaborating directly with the scientists who generate the data, we ensure every map we produce is grounded in rigorous, peer-reviewed science.

Our Resources

The intersection
of art &
elite science.

Woodwell Climate Research Center brings together world-class academic research and elite cartographic design. Led by two veteran specialists with almost forty years of combined experience, our team excels at distilling intricate datasets into compelling visual stories.

Veteran specialists
40+ years combined

  1. Elite Pedigree

    With a pedigree spanning Government National Laboratories and National Geographic, we offer a unique fusion of scientific precision and world-class design.

  2. The Woodwell Backdrop

    We operate in a premier academic research landscape — bolstered by specialists in various geospatial platforms, data science approaches, and climate variables we visualize.

  3. Technological Advantage

    We leverage licensing and strategic alliances with industry leaders like Esri and Google, backed by high-performance computing power to distill planetary-scale data.

  4. Public Recognition

    Validated by numerous industry awards and featured art exhibits, our work is proven to engage both the scientific community and broader public.

The Cartographers

Three specialists.
One shared map table.

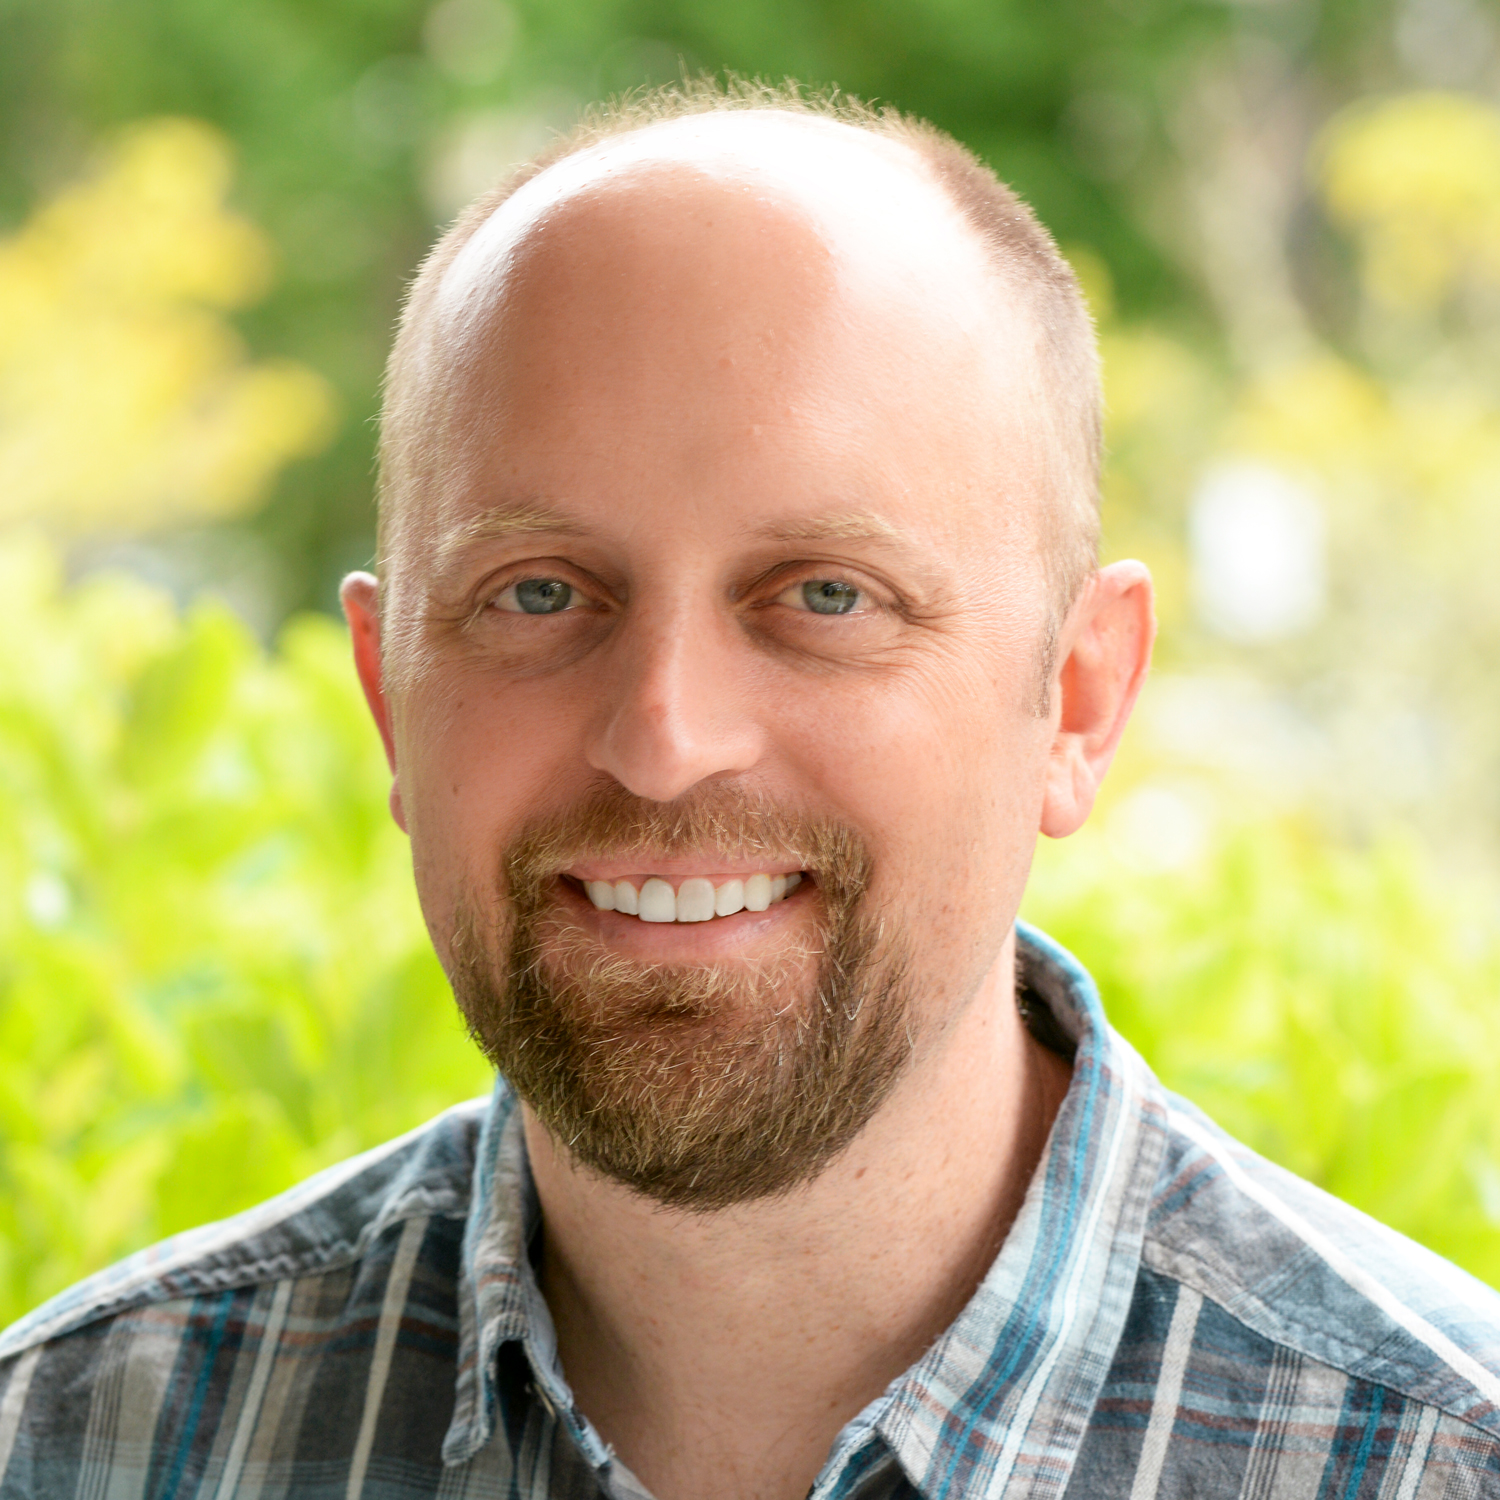
Gregory J. Fiske

Director of Geospatial Technology

Gregory J. Fiske, M.S.

Greg is a geographer and cartographer who administers the many technical aspects of Woodwell Climate Research Center's geospatial and data visualization activities. His background includes extensive use of GIS, cartography, remote sensing, and cloud-based spatial analysis. Prior to Woodwell, he worked at Lawrence Livermore National Laboratory. B.S., Plymouth State University; M.S., Oregon State University.
Profile at Woodwell

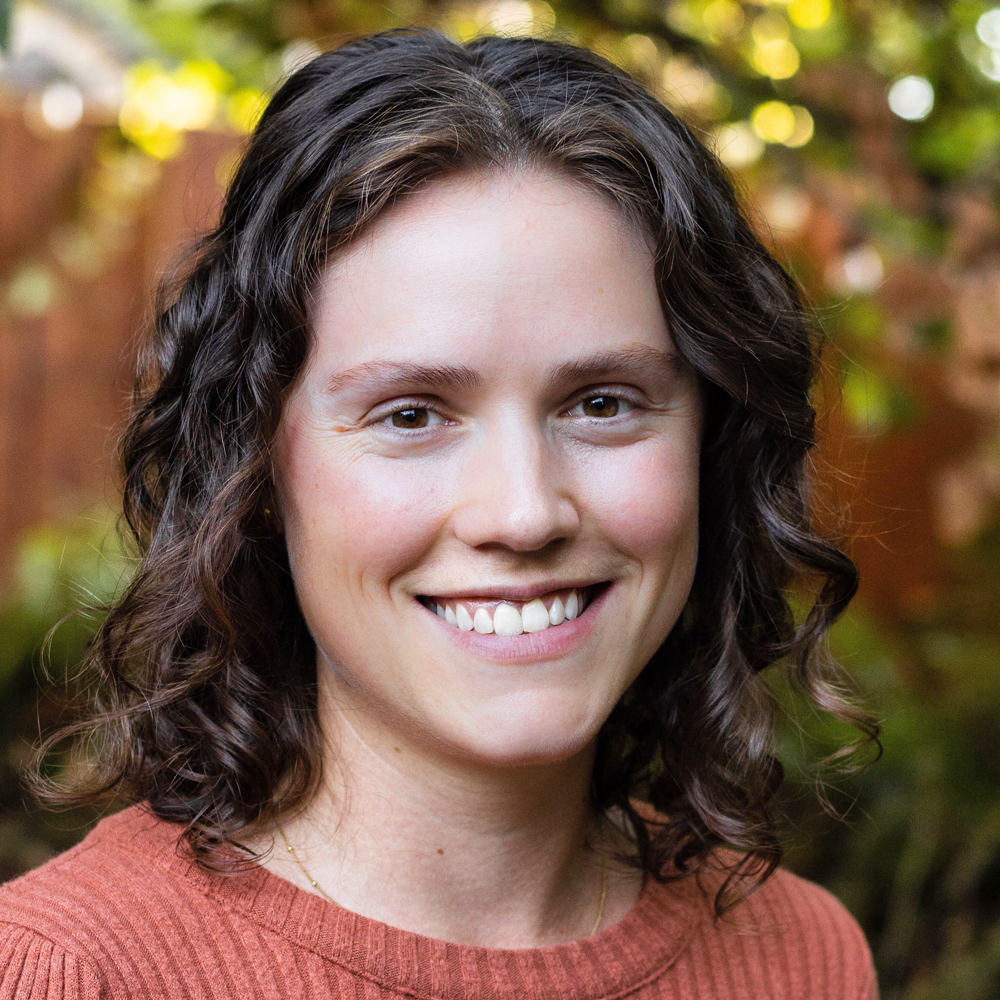
Christina Shintani

Cartographer

Christina Shintani, M.S.

Christina creates maps and data visualizations that communicate climate science for broad audiences and inform decision-making and policy. Before joining Woodwell, she was a cartographer and graphics editor at National Geographic magazine, covering climate change, conservation and biodiversity. She holds an M.S. in Geography from the University of Oregon, where she specialized in fluvial geomorphology and remote sensing of rivers. She is based in Portland, Oregon.

Profile at Woodwell

Jackie Dean

Cartographer

Jackie Dean

Jackie is a researcher and cartographer who creates maps that communicate geospatial and scientific analysis, with a focus on community-level climate impacts. Her expertise spans GIS, remote sensing, mapping workshops, and cartographic design. She has a Master's in Geography from the University of Hawaii and a B.S. from Cornell University, and is based in New Hampshire.

Profile at Woodwell

Feature Woodwell Climate Nov 2023

Meet the cartographers putting climate change on the map.

Greg and Christina share their insights on why modern cartography is indispensable for understanding our evolving planet.

Read the feature
Our science teams make the data, but the data itself can't change the world unless it is communicated in a meaningful way.
Greg Fiske Senior Geospatial Analyst

Collaborators

Scientists across Woodwell and beyond.

The vast majority of our work is collaborative — a co-authored effort with Woodwell experts in the Arctic, Tropics, Carbon, and Risk domains, alongside institutional partners like NASA, NOAA, the USGS, and the Arctic Council.